In this article, you will find a detailed overview of the Economic Survey of India 2026. In addition, India’s economic performance, covering government policies, sector-wise developments, historical context, release schedule, and the complete PDF report.
Economic Survey of India 2026: Complete Overview
The Economic Survey of India 2026 is one of the most important official documents released every year by the Government of India. It serves as a report card on the Indian economy, explaining how it has performed, what challenges it faces, and what opportunities lie ahead. In short, you can call it the “flagship document” that details the performance of the last 12 months across the various sectors of the Indian economy and provides a roadmap for the future.
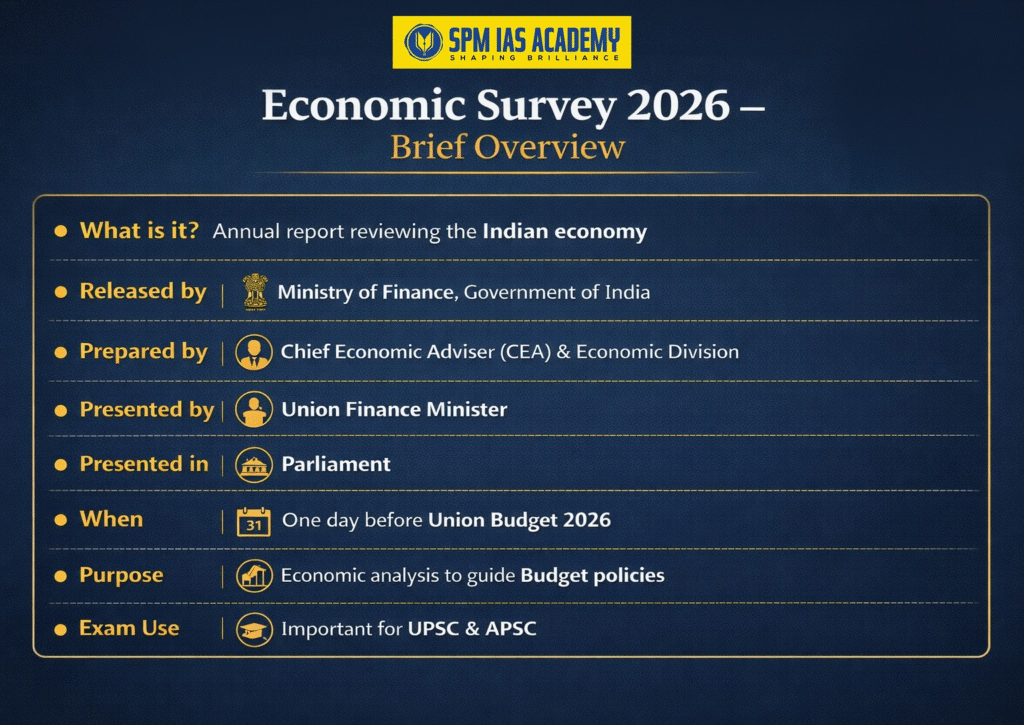
| Point | Economic Survey 2026 – Brief Overview |
| What is it? | Annual report reviewing the Indian economy |
| Released by | Ministry of Finance, Government of India |
| Prepared by | Chief Economic Adviser (CEA) & Economic Division |
| Presented by | Union Finance Minister |
| Presented in | Parliament |
| When | One day before Union Budget 2026 |
| Purpose | Economic analysis to guide Budget policies |
| Exam Use | Important for UPSC & APSC |
The Survey is released just before the Union Budget, making it a key document for understanding government priorities and future policy direction.
What is the Economic Survey?
The Economic Survey is an annual document prepared by the Department of Economic Affairs, Ministry of Finance, under the supervision of the Chief Economic Adviser (CEA) of India.
On January 29, 2026, Chief Economic Advisor V. Anantha Nageswaran presented the Economic Survey 2026, providing a comprehensive report card of the nation’s economy ahead of the Union Budget on February 1.
It presents a detailed and data-based analysis of India’s economic performance during the previous financial year.
Key Features of Economic Survey 2026
The Economic Survey is usually divided into two main parts:
- Part A: Covers major macroeconomic trends, an overall review of the economy, and the outlook for the coming year.
- Part B: Provides an in-depth, data-based analysis of important socio-economic areas such as health, education, climate change, and employment.
Comprehensive Review of Economic Performance
The Survey provides an in-depth analysis of India’s overall economic health, covering key indicators like growth, inflation, employment, and fiscal trends. This helps readers understand the big picture of the economy. Though it does not announce any new schemes or taxes, the survey helps policymakers, students, researchers, and the general public understand the economic environment of the country.
2. Sector-wise Analysis
The Part-B of the survey examines the performance of major sectors—agriculture, industry, climate-change, employment services, and infrastructure—highlighting strengths, weaknesses, and emerging trends in each area.
3. Pre-Budget Release
The Survey is released before the Union Budget to give policymakers a solid economic background. Highlighting the past performance and showing a direction to the future, it ensures that budget proposals are based on current data and informed insights. You can also sum up this survey as “non-binding economic guide.”
4. Data-driven and Analytical
Relying on official statistics and economic indicators, the Survey presents evidence-based analysis rather than mere opinions, making it a reliable resource for decision-making.
5. Policy Review and Future Strategies
It evaluates past and current government policies, suggesting reforms and strategies to address challenges and promote sustainable growth.
6. Reference for Stakeholders
The Economic Survey serves as a key reference for policymakers, researchers, and competitive exam aspirants, offering detailed insights and factual data for informed understanding and analysis
What is the History of the Economic Survey ?
Understanding the history of the Economic Survey helps explain why it is so important today. The first Economic Survey was presented in 1950–51 along with the Union Budget and was originally included as part of the Budget documents.
In 1964, it was separated from the Budget and started being presented as an independent report. This change allowed Parliament and policymakers to assess the country’s economic situation in advance. Since then, the Survey has played a key role in helping Parliament and policymakers assess economic challenges and opportunities before finalizing fiscal decisions.
Who prepares the Economic Survey ?
The document is prepared by the Economic Division of the Department of Economic Affairs under the Ministry of Finance. It is drafted under the guidance of the Chief Economic Adviser of India. A dedicated team of economists, analysts, and officials works together to collect data, review government policies, and study both domestic and global economic trends. That is why it is commonly known as the Economic Survey of the Ministry of Finance.
Economic Survey 2026 Release Date
- Economic Survey 2026 Release Date: 29 January 2026
- Union Budget 2026–27 Presentation: 1 February 2026
This follows the long-standing tradition of releasing the Survey before the Budget.
Economic Survey 2025–26 Chapter 1: State of Indian Economy, Growth Outlook & Key Data
Chapter 1 of the Economic Survey 2025–26 presents a comprehensive overview of India’s macroeconomic performance in a challenging global environment. Despite global slowdown, geopolitical tensions, and financial volatility, India continues to remain the fastest-growing major economy.
The Survey revises India’s potential growth rate to 7%, reflecting structural improvements rather than cyclical recovery. Growth is driven primarily by domestic demand, supported by government-led capital expenditure and resilient private consumption.
Public investment in infrastructure has acted as a crowding-in mechanism, stimulating private sector participation. The Survey emphasises that India’s growth story is now increasingly based on macroeconomic stability, formalisation, and productivity gains.
Key Economic Drivers
- Private consumption contributes over 60% of nominal GDP, reflecting rising incomes and demand.
- Investment share stabilises near 30% of GDP, aided by public capex crowding in private investment.
- Broad-based GVA growth across agriculture, industry, and services indicates balanced expansion.
Structural Growth Factors
- Capital accumulation through sustained public infrastructure spending.
- Labour input expansion due to formalisation, labour codes, and skilling.
- Total Factor Productivity (TFP) gains driven by Digital Public Infrastructure (DPI), regulatory simplification, and efficiency reforms.
Economic Survey 2026 – Chapter -2 : Fiscal Consolidation in Economic Survey 2025–26
Chapter 2 explains how fiscal Consolidation anchors stability. Fiscal policy builds trust in the economy. The Economic Survey 2025–26 says that careful fiscal consolidation helps India stay stable during global uncertainty. The government improved revenue collection after the pandemic, and strong fiscal management increased confidence in the economy.
The Survey highlights key improvements:
- Revenue receipts increased as a share of GDP after the pandemic
- Gross tax revenue remained strong and stable
- Direct taxes now form a larger share of total tax revenue, showing better tax compliance
The government also increased spending on capital projects. The Centre raised its effective capital expenditure from 2.7% of GDP before the pandemic to around 4% of GDP in FY25. States kept capital spending close to 2.4% of GDP, supported by central incentive schemes. This spending helps build roads, infrastructure, and long-term assets.
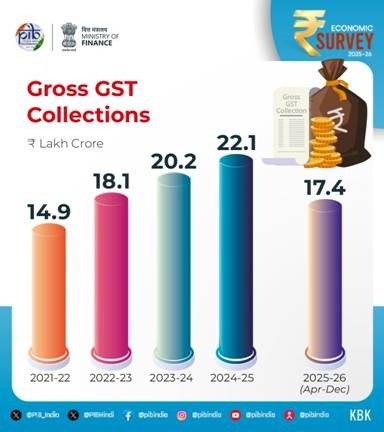
Image credit – PIB
The Survey proposes GST 2.0 reforms to simplify the tax system. It suggests a two-rate GST structure with 18% as the standard rate and 5% as the merit rate. These changes will make tax filing easier, boost consumption, support manufacturing, and fix inverted duty problems.
Overall, the Economic Survey shows that fiscal consolidation supports growth and stability. It helps the economy grow stronger without slowing development.
Economic Survey 2026, Chapter – 3 : Monetary Management and Financial Intermediation: Refining the Regulatory Touch
Chapter 3 explains how India’s monetary management and financial system support stable economic growth. The Economic Survey 2025–26 says that a strong banking sector, efficient credit flow, and wider financial inclusion help the economy remain resilient even during global uncertainties.
The Survey highlights key developments:
- Liquidity in the system stayed comfortable, with the Weighted Average Call Rate below the repo rate.
- Broad money (M3) grew in line with nominal GDP, keeping money supply balanced.
- Banks became healthier, with Gross NPAs at 2.2% and Net NPAs at 0.5%, the lowest in decades.
- Credit to Micro and Small Enterprises (MSEs) grew strongly at double-digit rates, supporting small businesses and entrepreneurship.
- Financial inclusion expanded rapidly: Jan Dhan accounts reached 55.02 crore, including 36.63 crore in rural and semi-urban areas.
- Pension and insurance coverage increased: APY and NPS enrollment rose, insurance premium income grew from ₹8.3 lakh crore (FY21) to ₹11.9 lakh crore (FY25), and total assets under management reached ₹77.4 lakh crore.
- Capital markets strengthened: unique investors crossed 12 crore, with 25% women, and demat accounts reached 21.6 crore.
Economic Survey 2026 Chapter – 4 : External Sector: Playing the Long Game
Chapter 4 explains how India takes a strategic, long-term approach to trade, investment, and external stability. The Economic Survey 2025–26 says that resilient exports, strong remittances, and rising foreign investment help India manage global uncertainties and build buffers against shocks.
The Survey highlights key developments:
- India’s merchandise trade stayed resilient despite global uncertainty, while services exports continued to offset the merchandise trade deficit.
- Services trade surplus remained strong, with services exports reaching USD 387.6 billion, growing 13.6% year-on-year.
- India’s total exports hit a record USD 825.3 billion in FY25, growing 6.1% year-on-year, driven mainly by services.
- Non-petroleum exports reached USD 374.3 billion, with non-petroleum, non-gems and jewellery exports forming nearly four-fifths of merchandise exports.
- The current account deficit (CAD) remained moderate at 0.8% of GDP in H1 FY26, supported by net inflows from services exports and remittances.
- India remained the world’s largest recipient of remittances, with inflows of USD 135.4 billion in FY25. Skilled workers from advanced economies contributed a growing share.
- Foreign exchange reserves rose to USD 701.4 billion by January 2026, providing 11 months of import cover and covering over 94% of external debt.
- India attracted USD 114 billion in Greenfield digital investments between 2020–2024, the highest globally, and ranked fourth in Greenfield investment announcements in 2024 with over 1,000 projects.
Implication: India enters 2026 with strong external buffers and a robust capacity to absorb global shocks.

The Survey concludes that India enters 2026 with strong external buffers and a robust capacity to absorb global shocks, supporting long-term economic stability.
Chapter 5 : Inflation – Tamed and Anchored
Chapter 5 explains how India achieved historically low inflation in 2025. The Economic Survey 2025–26 says that stable prices improved real incomes and strengthened policy credibility. Careful management of food supply, GST rationalisation, and favourable monsoon conditions helped keep inflation under control.
The Survey highlights key developments:
- India recorded the lowest headline inflation since the beginning of the CPI series, with average inflation of 1.7% from April to December 2025.
- Food inflation turned negative due to falling prices of vegetables and pulses.
- Disinflation in food and fuel, which make up 52.7% of the CPI basket, contributed significantly to the low inflation.
- Other contributing factors included strong base effects, improved foodgrain stocks, GST rate rationalisation, favourable monsoon and climate conditions, and moderate global commodity prices.
- Among major Emerging Markets and Developing Economies (EMDEs), India recorded one of the sharpest declines in headline inflation in 2025, dropping 1.8 percentage points over 2024.
Implication: Stable inflation supports higher real incomes and strengthens confidence in economic policies.
Chapter 6 : Agriculture and Food Management – Raising Productivity, Securing Incomes and Ensuring Food Security
Chapter 6 explains how India is improving agricultural productivity, securing farmers’ incomes, and ensuring food security. The Economic Survey 2025–26 says that structural diversification, better infrastructure, and income support strengthen rural resilience and make agriculture more sustainable.
The Survey highlights key developments:
- Sectoral Growth (FY20–FY24 average):
- Crops: ~4.7%
- Livestock: ~6.1%
- Fisheries & aquaculture: ~7.2%
- Crops: ~4.7%
- Livestock sector grew strongly between FY15 and FY24, with GVA rising nearly 195%.
- Fisheries production increased by over 140% during 2014–2024.
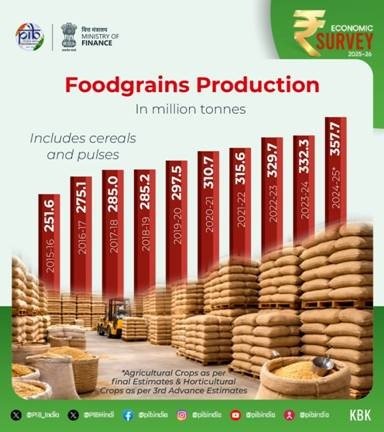
- Foodgrain production reached an estimated 3,577.3 lakh metric tonnes (LMT) in AY 2024–25, up 254.3 LMT from the previous year, driven by higher output of rice, wheat, maize, and coarse cereals.
- Horticulture, accounting for 33% of agricultural GVA, grew to 362.08 million tonnes (MT) in 2024–25, surpassing foodgrain production.
- Policy and Income Support:
- Crop diversification is aligned with soil and rainfall patterns.
- Fertiliser use is balanced based on soil health.
- Farmers’ incomes are supported through PM-KISAN, MSP, crop insurance, and PM Kisan Maandhan Yojana (PMKMY) pensions.
- Under PM-KISAN, over ₹4.09 lakh crore has been transferred in 21 instalments; 24.92 lakh farmers are enrolled in PMKMY as of 31 December 2025.
- Crop diversification is aligned with soil and rainfall patterns.
- Institutional and Infrastructure Support:
- Digital Agriculture Mission promotes technology adoption.
- Farmer Producer Organisations (FPOs) are being strengthened.
- Fisheries and livestock disease control programmes improve sector health.
- Agriculture Marketing Infrastructure (AMI) and Agriculture Infrastructure Fund (AIF) improve farm-gate facilities and encourage private investment.
- e-NAM has onboarded 1.79 crore farmers, 2.72 crore traders, and 4,698 FPOs, covering 1,522 mandis across 23 States and 4 UTs, enhancing price discovery.
- Digital Agriculture Mission promotes technology adoption.
Chapter 7 : Services – From Stability to New Frontiers
Chapter 7 explains how the services sector drives India’s economic growth, employment, and exports. The Economic Survey 2025–26 says that modern, digitally delivered services, along with traditional services, are expanding rapidly and supporting urban jobs and foreign investment.
The Survey highlights key developments:
- Services account for over 60% of GDP, with a share of 53.6% in H1 FY26 and 56.4% in GVA (FAE FY26), reflecting the growing importance of tradable and digitally delivered services.
- Nearly 62% of urban employment comes from services, and the sector contributes over half of new formal jobs.
- India is the world’s seventh-largest exporter of services, with its share in global services trade more than doubling from 2% in 2005 to 4.3% in 2024.
- Emerging frontiers include IT and software services, professional consulting, the space economy, tourism and wellness (including medical tourism), and media, entertainment, and gaming.
- The services sector remains the largest recipient of foreign direct investment, accounting for an average of 80.2% of total FDI during FY23–FY25, up from 77.7% in FY16–FY20.
Implication: The services sector drives exports, creates jobs, and supports urban economic growth, reinforcing India’s position as a global hub for modern services.
Implication: Productivity-led agriculture, better market access, and income support strengthen rural resilience and make the sector more sustainable.
Industry’s Next Leap – Structural Transformation and Global Integration
Chapter 8 explains how India’s industry is undergoing technology-driven transformation, strengthening competitiveness, creating jobs, and supporting global integration. The Economic Survey 2025–26 says that strong industrial growth, strategic investment schemes, and innovation-led initiatives are driving structural recovery.
The Survey highlights key developments:
- Industrial Growth:
- Industry GVA grew 7.0% in H1 FY26 despite global headwinds.
- Manufacturing GVA expanded 7.72% in Q1 and 9.13% in Q2 FY26.
- Medium and high-tech industries now contribute 46.3% of manufacturing value added.
- Industry GVA grew 7.0% in H1 FY26 despite global headwinds.
- Sectoral Performance:
- Steel, cement, and coal: rising domestic production.
- Pharmaceuticals: steady export growth.
- Automobiles and EVs: rapid expansion.
- Electronics: nearly 30-fold rise in mobile manufacturing value since FY15.
- Steel, cement, and coal: rising domestic production.
- Innovation Indicators:
- Patent applications nearly doubled between FY20 and FY25.
- India ranks among global leaders in trademarks, patents, and industrial designs.
- Global Innovation Index rank improved to 38th in 2025 from 66th in 2019.
- India Semiconductor Mission approved 10 semiconductor manufacturing and packaging projects across six States, with about ₹1.60 lakh crore of investment.
- Patent applications nearly doubled between FY20 and FY25.
- Investment and Employment:
- Production Linked Incentive (PLI) schemes across 14 sectors attracted over ₹2.0 lakh crore in actual investment.
- Incremental production and sales exceeded ₹18.7 lakh crore.
- Over 12.6 lakh jobs generated as of September 2025.
- Production Linked Incentive (PLI) schemes across 14 sectors attracted over ₹2.0 lakh crore in actual investment.
Implication: Technology-driven industrial growth, innovation, and strategic investment are strengthening India’s manufacturing capabilities, creating jobs, and supporting long-term economic transformation.
Investment and Infrastructure – Strengthening Connectivity, Capacity and Competitiveness
Chapter 9 explains how strategic infrastructure investment boosts economic growth, competitiveness, and resilience. The Economic Survey 2025–26 says that steady capital expenditure, enhanced transport, power, digital, and space infrastructure are key drivers of India’s long-term development.
The Survey highlights key developments:
- Public Investment:
- Government capital expenditure increased nearly 4.2 times, from ₹2.63 lakh crore (FY18) to ₹11.21 lakh crore (FY26 BE).
- Effective capital expenditure in FY26 (BE) is ₹15.48 lakh crore, positioning infrastructure as a key growth driver.
- Government capital expenditure increased nearly 4.2 times, from ₹2.63 lakh crore (FY18) to ₹11.21 lakh crore (FY26 BE).
- Transport and Connectivity:
- National highway network expanded by 60%, from 91,287 km (FY14) to 1,46,572 km (FY26).
- Operational High-Speed Corridors grew nearly ten-fold from 550 km (FY14) to 5,364 km.
- Rail network reached 69,439 route km, with 3,500 km planned addition in FY26, and 99.1% electrification achieved.
- India became the world’s third-largest domestic aviation market, with airports increasing from 74 in 2014 to 164 in 2025.
- National highway network expanded by 60%, from 91,287 km (FY14) to 1,46,572 km (FY26).
- Power Sector:
- Installed capacity rose 11.6% y-o-y to 509.74 GW; demand–supply gap reduced to zero.
- DISCOMs recorded a positive PAT of ₹2,701 crore for the first time in FY25.
- AT&C losses fell from 22.62% (FY14) to 15.04% (FY25).
- Renewable energy accounts for 49.83% of total generation; India ranks third globally in renewable and installed solar capacity.
- Installed capacity rose 11.6% y-o-y to 509.74 GW; demand–supply gap reduced to zero.
- Digital and Rural Infrastructure:
- Tele-density reached 86.76%; 5G services are now available in 99.9% of districts.
- Over 81% of rural households have access to clean tap water under Jal Jeevan Mission (as of October 2025).
- Tele-density reached 86.76%; 5G services are now available in 99.9% of districts.
- Space Infrastructure:
- India became the fourth nation to achieve autonomous satellite docking (SpaDeX).
- Indigenous space missions expanded, with increased private-sector participation.
- India became the fourth nation to achieve autonomous satellite docking (SpaDeX).
Implication: Strategic investment in transport, power, digital, water, and space infrastructure strengthens India’s connectivity, enhances competitiveness, supports private investment, and drives long-term economic growth.
Environment and Climate Change – Building a Resilient, Competitive, and Development-Driven India
Chapter 10 explains how India is strengthening its renewable energy capacity and climate resilience while supporting sustainable development. The Economic Survey 2025–26 notes that clean energy expansion is central to India’s growth, competitiveness, and environmental sustainability.
The Survey highlights key developments:
- Renewable Energy Capacity (up to 31 December 2025):
- Total installed capacity: 38.61 GW.
- Solar power: 30.16 GW.
- Wind power: 4.47 GW.
- Bio-Power: 0.03 GW.
- Hydro power: 3.24 GW.
- Total installed capacity: 38.61 GW.
Implication: Rapid expansion of renewable energy strengthens India’s climate resilience, supports sustainable development, and enhances energy security.
Education and Health – What Works and What’s Next
Chapter 11 explains how India is improving access, quality, and outcomes in education and health. The Economic Survey 2025–26 highlights that strategic reforms, infrastructure expansion, and targeted schemes have strengthened learning outcomes, higher education access, and public health indicators.
The Survey highlights key developments:
- School Education:
- India operates one of the world’s largest school systems, serving 24.69 crore students across 14.71 lakh schools, supported by over 1.01 crore teachers (UDISE+ 2024–25).
- Gross Enrolment Ratio (GER):
- Primary (Grade I–V): 90.9%
- Upper Primary (Grade VI–VIII): 90.3%
- Secondary (Grade IX–X): 78.7%
- Higher Secondary (Grade XI–XII): 58.4%
- Primary (Grade I–V): 90.9%
- Key schemes promoting access and equity: Poshan Shakti Nirman and Samagra Shiksha Abhiyan.
- India operates one of the world’s largest school systems, serving 24.69 crore students across 14.71 lakh schools, supported by over 1.01 crore teachers (UDISE+ 2024–25).
- Higher Education:
- Number of higher education institutions increased from 51,534 (2014–15) to 70,018 (June 2025).
- Premier institutions include 23 IITs, 21 IIMs, and 20 AIIMS, with two international IIT campuses in Zanzibar and Abu Dhabi.
- NEP reforms implemented:
- National Credit Framework (NCrF) adopted by 170 universities to blend academic and skills-based learning.
- Academic Bank of Credit covers 2,660 institutions; over 4.6 crore IDs issued, including 2.2 crore APAAR IDs.
- 153 universities have introduced flexible entry-exit pathways and biannual admissions to achieve 50% GER by 2035.
- National Credit Framework (NCrF) adopted by 170 universities to blend academic and skills-based learning.
- Number of higher education institutions increased from 51,534 (2014–15) to 70,018 (June 2025).
- Health:
- Maternal Mortality Rate (MMR) declined 86% since 1990, surpassing the global reduction of 48%.
- Under-five Mortality Rate (U5MR) declined 78%, exceeding the global 61% decline.
- Neonatal Mortality Rate (NMR) declined 70% compared to 54% globally (1990–2023).
- Infant Mortality Rate (IMR) declined over 37% in the past decade, from 40 deaths per 1,000 live births in 2013 to 25 in 2023.
- Maternal Mortality Rate (MMR) declined 86% since 1990, surpassing the global reduction of 48%.
Implication: Strategic investments in school and higher education, alongside health interventions, have significantly improved access, learning outcomes, and public health, positioning India for sustainable human capital development.
Employment and Skill Development – Getting Skilling Right
Chapter 12 explains how India is strengthening employment generation and skill development to enhance workforce productivity and support inclusive growth. The Economic Survey 2025–26 highlights job creation, reforms in labour laws, and improvements in the skilling ecosystem as key drivers of labour market resilience.
The Survey highlights key developments:
- Employment Trends:
- Total employed (aged 15+): 56.2 crore in Q2 FY26, with 8.7 lakh new jobs created compared to Q1 FY26.
- Manufacturing sector employment grew 6% YoY in FY24, adding over 10 lakh jobs compared to FY23 (Annual Survey of Industries).
- Labour Codes formally recognise gig and platform workers, expanding social security, welfare funds, and benefit portability.
- Total employed (aged 15+): 56.2 crore in Q2 FY26, with 8.7 lakh new jobs created compared to Q1 FY26.
- Unorganised Sector Coverage:
- e-Shram portal registered over 31 crore unorganised workers as of January 2026.
- Women constitute over 54% of total registrants, strengthening gender-focused welfare outreach.
- e-Shram portal registered over 31 crore unorganised workers as of January 2026.
- Job Matching and Career Services:
- National Career Service (NCS) connects job seekers, employers, and training providers.
- Over 59 million job seekers and 5.3 million job providers registered.
- Approximately 80 million vacancies mobilised across diverse sectors.
- National Career Service (NCS) connects job seekers, employers, and training providers.
- Skill Development Ecosystem:
- National Scheme for Upgradation of ITIs plans to modernise 1,000 government ITIs (200 hub + 800 spoke).
- Upgrades include smart classrooms, modern labs, digital content, and industry-aligned long- and short-term courses.
- National Scheme for Upgradation of ITIs plans to modernise 1,000 government ITIs (200 hub + 800 spoke).
Implication: Targeted skill development, expanded employment coverage, and labour reforms are improving workforce quality, promoting gender equity, and supporting
Rural Development and Social Progress – From Participation to Partnership
Chapter 13 explains how India is promoting rural development, reducing poverty, and strengthening social services through participation and technology-driven initiatives. The Economic Survey 2025–26 highlights improvements in social protection, rural asset ownership, and service delivery as key drivers of inclusive growth.
The Survey highlights key developments:
- Poverty and Social Services:
- World Bank updated the poverty line from USD 2.15 to USD 3.00 per day (PPP, 2021 prices).
- India’s poverty rates (2022–23) under revised IPL:
- Extreme poverty: 5.3%
- Lower-middle-income poverty: 23.9%
- Extreme poverty: 5.3%
- General government social services expenditure (SSE) shows a rising trend:
- 7% of GDP (FY23–24) → 7.7% (FY24–25 RE) → 7.9% (FY25–26 BE).
- 7% of GDP (FY23–24) → 7.7% (FY24–25 RE) → 7.9% (FY25–26 BE).
- World Bank updated the poverty line from USD 2.15 to USD 3.00 per day (PPP, 2021 prices).
- Rural Economy and Technology Use:
- SVAMITVA drone survey completed in 3.28 lakh villages (out of 3.44 lakh targeted).
- 2.76 crore property cards prepared for nearly 1.82 lakh villages.
- Lead Fertiliser Companies distributed 1,094 drones to SHG Drone Didis in 2023–24, including 500 under Namo Drone Didi Scheme.
- SVAMITVA drone survey completed in 3.28 lakh villages (out of 3.44 lakh targeted).
Implication: Expansion of social services, poverty reduction, and use of technology in rural property mapping strengthen rural livelihoods, promote inclusive development, and enhance governance at the village level.
Evolution of the AI Ecosystem in India – The Way Forward
Chapter 14 explains how India is building a practical and inclusive AI ecosystem. The Economic Survey 2025–26 highlights that AI adoption is driven by real-world problems, fostering innovation, improving efficiency, and expanding access across diverse sectors.
The Survey highlights key developments:
- Task-Specific AI Models:
- Smaller, task-focused AI models are being deployed across sectors.
- These models help diffuse innovation more evenly and lower entry barriers for firms.
- They are better suited to India’s diverse economic and social landscape.
- Smaller, task-focused AI models are being deployed across sectors.
- Sectoral Adoption:
- Healthcare, agriculture, urban management, education, disaster preparedness, and public administration are emerging as key areas for AI deployment.
- AI solutions are designed to work on local hardware and operate effectively in low-resource settings.
- Healthcare, agriculture, urban management, education, disaster preparedness, and public administration are emerging as key areas for AI deployment.
Implication: By focusing on practical, context-specific AI applications, India is building an ecosystem that supports innovation, solves real-world challenges, and ensures broad-based economic and social impact.
Urbanisation – Making India’s Cities Work for Its Citizens
Chapter 15 explains how India is improving urban infrastructure and connectivity to make cities more livable, inclusive, and productive. The Economic Survey 2025–26 highlights that strategic urban planning and high-speed regional transit systems can expand job access, ease congestion, and promote balanced urban growth.
The Survey highlights key developments:
- Urban Connectivity:
- High-speed regional transit systems, such as the Namo Bharat Regional Rapid Transit System, reduce travel times between cities and surrounding regions.
- Improved connectivity expands access to jobs and supports polycentric urban growth.
- Such systems help ease pressure on core metropolitan areas by facilitating the movement of people and labour.
- High-speed regional transit systems, such as the Namo Bharat Regional Rapid Transit System, reduce travel times between cities and surrounding regions.
Implication: Efficient urban transport and planning enhance productivity, support inclusive labour markets, and make India’s cities more resilient and citizen-friendly.
Building a Resilient and Indispensable India
India is moving beyond simple import substitution to a strategic framework that strengthens domestic capabilities, reduces vulnerabilities, and embeds the country in global value chains. By combining disciplined indigenisation, cost-competitive inputs, and smart integration into international markets, India is progressing from Swadeshi → Strategic Resilience → Strategic Indispensability. This approach not only enhances national strength and competitiveness but also positions India as a systemically indispensable player in the global economy, where “buying Indian” becomes automatic rather than deliberate.
Economic Survey 2026 PDF Download
The Economic Survey 2026 PDF is officially released by the Government of India for public access. It contains:
- Detailed economic analysis
- Sector-wise performance review
- Policy recommendations
- Release Date: 29 January 2026
- Download Source: Official government portals
Download Economic Survey 2026 PDF
Why is the Economic Survey Released Before the Union Budget?
1. Presenting the Current Economic Scenario
The Economic Survey gives a comprehensive picture of India’s economy at the macro and sectoral levels. It analyses growth trends, inflation, fiscal deficit, employment, and external trade, helping readers understand the overall economic health of the country before the Budget is announced.
2. Highlighting Key Challenges and Opportunities
By identifying structural issues, emerging risks, and growth opportunities, the Survey helps policymakers and Parliament grasp the major challenges facing the economy. This includes concerns related to public finance, social sectors, infrastructure, and global economic conditions.
3. Guiding Budget Formulation and Spending Priorities
The findings and recommendations of the Economic Survey act as a base document for Budget preparation. Its data-driven insights influence policy direction, allocation of funds, and priority sectors, ensuring that government spending aligns with economic needs and long-term goals.
4. Ensuring Transparency and Informed Decision-Making
Releasing the Economic Survey before the Budget promotes transparency in fiscal planning. It allows Parliament, researchers, and citizens to evaluate the rationale behind budget proposals and supports informed, evidence-based discussions on economic policy.
Difference Between Economic Survey and Union Budget
The Economic Survey and the Union Budget are both important annual documents, but they serve different purposes. The Survey is an analytical report that reviews India’s economic performance, sector trends, and future outlook, while the Budget is a financial statement outlining government revenue, expenditure, and fiscal priorities. Released before the Budget, the Survey helps guide informed policy and spending decisions.
| Aspect | Economic Survey | Union Budget |
| Nature | Analytical report on the economy | Legal financial statement of government |
| Purpose | Review economic performance and suggest policies | Allocate resources, announce taxes and schemes |
| Content | GDP trends, inflation, employment, sector-wise analysis | Government revenue, expenditure, fiscal deficit, schemes |
| Timing | Released before the Budget | Released after the Survey |
| Binding Nature | Advisory, non-binding | Legally binding |
| Prepared By | Chief Economic Adviser & Ministry of Finance | Finance Minister & Ministry of Finance |
| Focus | Economic trends, challenges, and future outlook | Financial planning and fiscal management |
| Political Nature | Objective and neutral | Policy-oriented |
| Frequency | Annual | Annual |
Conclusion
The Economic Survey 2026 is an indispensable resource for aspirants of UPSC, APSC, and other State PCS exams. It not only provides a comprehensive overview of India’s economic performance—covering growth, inflation, employment, and sector-wise trends—but also highlights policy reforms, government initiatives, and future economic directions.
Studying the Survey helps aspirants connect current affairs with economic concepts, making answers more analytical and well-rounded. It also improves decision-making insights, which are crucial for essay writing and interview discussions.
In short, a proper understanding of the Economic Survey can sharpen exam readiness, boost confidence, and provide a strong foundation for interpreting India’s economic challenges and opportunities.