The top 10 economies in the world by GDP (nominal) in 2026 are the United States, China, Germany, India, Japan, United Kingdom, France, Italy, Brazil, and Canada – in that order, based on IMF projections. On the basis of Purchasing Power Parity (PPP), the ranking shifts significantly: China leads at $43.5 trillion, followed by the United States, India, Russia, and Japan. What are the key differences? Nominal GDP uses current market exchange rates, while PPP adjusts for the actual cost of living in each country.
What Is GDP (Gross Domestic Product) and Why Does It Matter?
GDP or Gross Domestic Product, is the total monetary value of all goods and services produced within a country in a given year. It is the single most widely used measure of a country’s economic size. A higher GDP generally indicates a stronger economy, more employment and better living standards.
However, GDP comes in two major forms. These are Nominal GDP and GDP by Purchasing Power Parity (PPP). Understanding the difference is crucial before comparing countries.
Nominal GDP vs GDP by PPP: What Is the Difference?
Both rankings tell you something important about a country’s economy, but they answer different questions. Therefore, you should choose the right metric based on your purpose.
| Nominal GDP | GDP by Purchasing Power Parity (PPP) |
| Measures output at current market exchange rates | Adjusts GDP for cost-of-living differences across countries |
| Best for international trade and finance comparisons | Better for comparison between living standards and domestic purchasing power |
| Affected by currency fluctuations and inflation | Shows the real value of what money can buy locally |
| Favours nations with strong currencies | Favours large, lower-cost emerging economies |
| India nominal GDP projected to be: ~$4.51 trillion (IMF) in 2026 | India PPP GDP projected to reach ~$19.14 trillion in 2026 |
As a result of this difference, the same country can rank very differently on the two lists. For example, India ranks 4th by nominal GDP but 3rd by PPP. The cost of goods and services in India is much lower than in the West. So, the same amount of money buys far more. A meal that costs $20 in Frankfurt might cost just $3 in Mumbai. PPP captures this real difference in purchasing power.
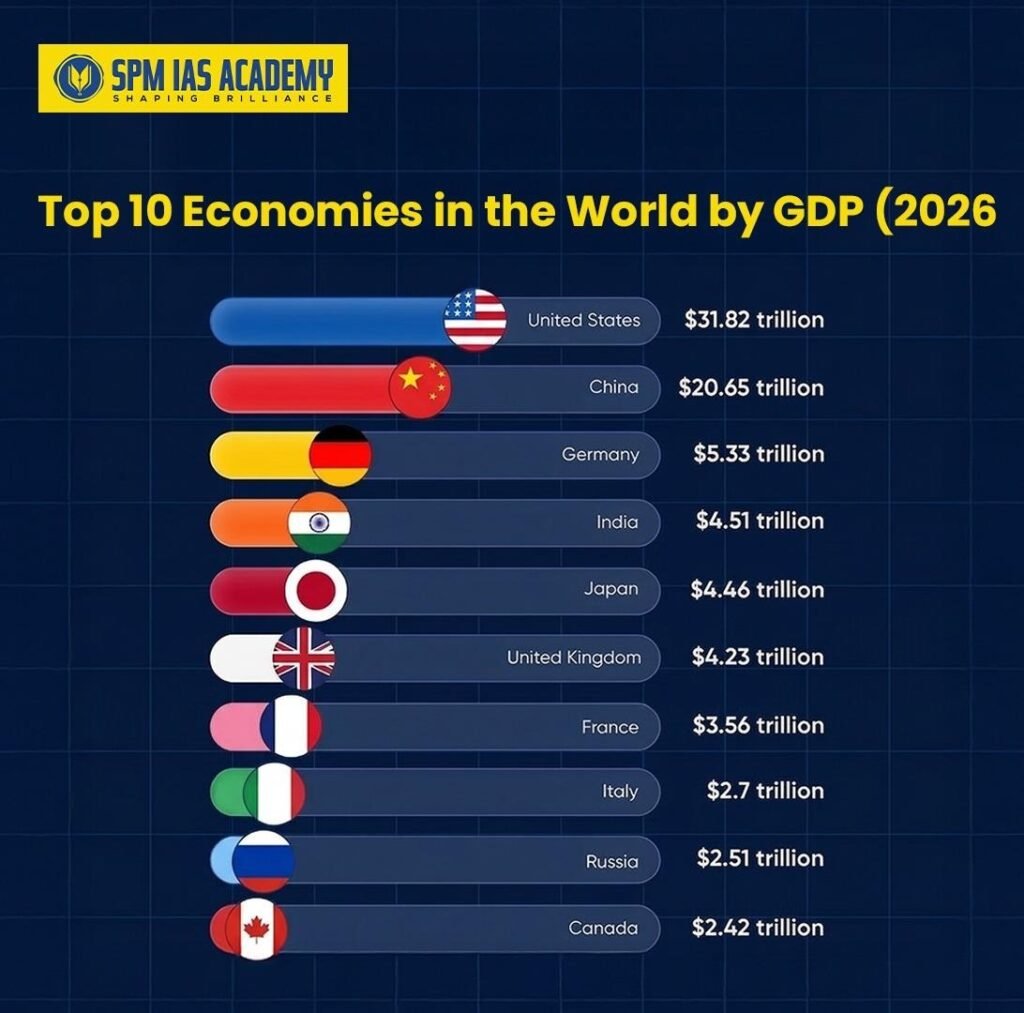
Top 10 Economies in the World by GDP (2026):
Top 10 Economies by Nominal GDP in 2026
Nominal GDP rankings reflect the raw size of each economy in US dollar terms at current exchange rates. According to the IMF World Economic Outlook, here are the world’s 10 largest economies by nominal GDP in 2026:
| Rank | Country | Nominal GDP (USD Trillion) | GDP Growth Rate | Global GDP Share (%) |
| 1 | United States | $31.8T | 2.1% | ~25.7% |
| 2 | China | $20.7T | 4.2% | ~16.7% |
| 3 | Germany | $4.9T | 0.9% | ~4.0% |
| 4 | India | $4.3T | 6.2% | ~3.5% |
| 5 | Japan | $4.3T | 0.9% | ~3.5% |
| 6 | United Kingdom | $3.5T | 1.6% | ~2.8% |
| 7 | France | $3.2T | 0.8% | ~2.6% |
| 8 | Italy | $2.4T | 0.7% | ~1.9% |
| 9 | Brazil | $2.3T | 2.2% | ~1.9% |
| 10 | Canada | $2.2T | 1.6% | ~1.8% |
Note: Source: IMF World Economic Outlook, October 2025 projections for 2026. GDP values are approximate.
Top 10 Economies by GDP (PPP) in 2026
PPP rankings paint a very different picture of global economic power. When you adjust for the actual cost of goods and services in each country, several large emerging economies jump dramatically up the list. Here are the top 10 economies by GDP (PPP) for 2026 (IMF data):
| Rank | Country | PPP GDP (USD Trillion, Intl. $) | PPP Rank vs Nominal Rank |
| 1 | China | $43.5T | Up 1 (was 2nd by nominal) |
| 2 | United States | $31.8T | Down 1 (was 1st by nominal) |
| 3 | India | $19.1T | Up 1 (was 4th by nominal) |
| 4 | Russia | $7.3T | Big jump (not in nominal top 10) |
| 5 | Japan | $6.9T | Similar range |
| 6 | Germany | $6.3T | Down 3 (was 3rd by nominal) |
| 7 | Indonesia | $5.4T | Enters top 10 (not in nominal top 10) |
| 8 | Brazil | $5.2T | Up 1 (was 9th by nominal) |
| 9 | France | $4.7T | Similar range |
| 10 | United Kingdom | $4.6T | Similar range |
Note: Source: IMF World Economic Outlook & List of Countries by GDP (PPP), 2026 estimates.
Key Insight: China leads the world by PPP at $43.5 trillion — far ahead of its $20.7 trillion nominal GDP. Russia moves from outside the nominal top 10 all the way to 4th place by PPP. Indonesia enters the PPP top 10 despite not appearing in the nominal top 10. This shows how strongly lower living costs boost an emerging economy’s effective economic size.
Country-by-Country Breakdown: Top 10 Economies in the world
Now let us look more closely at each of the top 10 economies. Understanding what drives each country’s GDP helps you see the bigger picture of global economic power.
1. United States: GDP (Nominal) rank – 1st, GDP (PPP) rank – 2nd
| Fact | Details |
| Nominal GDP | $31.8 Trillion |
| PPP GDP | $31.8 Trillion |
| GDP Growth Rate | 2.1% |
| Global GDP Share | ~25.7% |
The United States remains the world’s largest economy by nominal GDP with $31.8 trillion – more than the next two countries combined. Its economy runs on strong consumer spending, technology, finance, and services. Despite trade policy shifts, real GDP growth stays steady at 2.1% in 2026. The US dollar’s status as the world’s reserve currency gives it a unique advantage, as demand for dollars remains consistently high across global trade.
2. China: GDP (Nominal) rank – 2nd, GDP (PPP) rank – 1st
| Fact | Details |
| Nominal GDP | $20.7 Trillion |
| PPP GDP | $43.5 Trillion |
| GDP Growth Rate | 4.2% |
| Global GDP Share | ~16.7% |
China is the world’s largest economy by PPP and second by nominal GDP. It has held the top PPP spot since 2014. With a massive manufacturing base and a huge domestic market, China continues to transition toward advanced manufacturing and technology exports while managing challenges such as high debt levels and an aging population. Its PPP GDP of $43.5 trillion is more than double its nominal figure, reflecting how low domestic costs amplify its actual economic output.
3. Germany: GDP (Nominal) rank – 3, GDP (PPP) rank – 6
| Fact | Details |
| Nominal GDP | $4.9 Trillion |
| PPP GDP | $6.3 Trillion |
| GDP Growth Rate | 0.9% |
| Global GDP Share | ~4.0% |
Germany is Europe’s largest economy and the world’s 3rd largest by nominal GDP. However, it faces deep structural challenges. Following two consecutive years of recession, it barely grew in 2025. High energy costs, weak export demand, and slow industrial investment weigh on growth. Despite these pressures, Germany remains a global leader in engineering, automotive manufacturing, and precision machinery.
4. India: GDP (Nominal) rank – 4, GDP (PPP) rank – 3
| Fact | Details |
| Nominal GDP | $4.51 Trillion |
| PPP GDP | $19.14 Trillion |
| GDP Growth Rate | 6.2% |
| Global GDP Share | ~3.5% |
India made history by surpassing Japan to become the 4th largest economy by nominal GDP. With a 6.2% growth rate, the fastest among all major economies, it powers ahead through strong domestic demand, infrastructure investment, and a booming services sector. By PPP, India ranks 3rd globally. India’s large, young, and growing workforce continues to be one of its greatest economic assets.
5. Japan: GDP (Nominal) rank – 5, GDP (PPP) – 5
| Fact | Details |
| Nominal GDP | $4.3 Trillion |
| PPP GDP | $6.9 Trillion |
| GDP Growth Rate | 0.9% |
| Global GDP Share | ~3.5% |
Japan drops to 5th place in 2026 as India overtakes it. Its economy faces headwinds from an aging population and decades of deflation. Currency depreciation also reduces its dollar-denominated GDP. Despite these challenges, Japan still leads globally in technology, robotics, and automotive exports, and continues to play a major role in global supply chains.
6. United Kingdom: GDP (Nominal) rank – 6, GDP (PPP) rank – 10
| Fact | Details |
| Nominal GDP | $3.5 Trillion |
| PPP GDP | $4.6 Trillion |
| GDP Growth Rate | 1.6% |
| Global GDP Share | ~2.8% |
The United Kingdom holds its place as the 6th largest economy globally. London remains one of the world’s top financial centres, and the services sector, especially financial services, media, and technology continues to dominate economic output. The UK’s economic growth of 1.6% is moderate, as the country adjusts to post-Brexit trade conditions and ongoing inflation pressures.
7. France: GDP (Nominal) rank – 7, GDP (PPP) rank – 9
| Fact | Details |
| Nominal GDP | $3.2 Trillion |
| PPP GDP | $4.7 Trillion |
| GDP Growth Rate | 0.8% |
| Global GDP Share | ~2.6% |
France is the 7th largest economy in the world and one of Europe’s most influential. Its economy draws strength from luxury goods, aerospace, agriculture, and tourism. Slow growth of 0.8% in 2026 reflects broader European structural constraints, high public spending, and labour market rigidity. Nevertheless, France remains a global cultural and economic powerhouse.
8. Italy: GDP (Nominal) rank – 8, GDP (PPP) rank – 12
| Fact | Details |
| Nominal GDP | $2.4 Trillion |
| PPP GDP | $3.8 Trillion |
| GDP Growth Rate | 0.7% |
| Global GDP Share | ~1.9% |
Italy ranks 8th globally despite facing long-standing structural challenges including slow growth, high public debt, and political instability. Its strengths lie in design, fashion, food, and a sophisticated manufacturing sector concentrated in the northern regions. Italy also benefits from strong exports in machinery, vehicles, and luxury consumer goods.
9. Brazil: GDP (Nominal) – 9, GDP (PPP) rank – 8
| Fact | Details |
| Nominal GDP | $2.3 Trillion |
| PPP GDP | $5.2 Trillion |
| GDP Growth Rate | 2.2% |
| Global GDP Share | ~1.9% |
Brazil is the largest economy in Latin America and the 9th largest in the world. A commodity-rich powerhouse, it exports soybeans, iron ore, and crude oil. Its PPP GDP of $5.2 trillion is notably higher than its nominal GDP, reflecting lower domestic costs. Growth of 2.2% outpaces most European peers. Brazil also benefits from a large domestic market and growing middle class.
10. Canada: GDP (Nominal) rank – 10, GDP (PPP) rank – 17
| Fact | Details |
| Nominal GDP | $2.2 Trillion |
| PPP GDP | $2.8 Trillion |
| GDP Growth Rate | 1.6% |
| Global GDP Share | ~1.8% |
Canada rounds out the top 10 with a $2.2 trillion nominal GDP. A resource-rich, trade-dependent nation, it exports oil, minerals, and agricultural products. Close economic ties with the United States mean any changes in US trade policy directly affect Canada’s growth outlook. Its stable financial system and high standard of living support steady, if modest, growth.
Why India’s Rise in the World GDP Ranking Is a Big Deal
India’s ascent in the world GDP ranking list is one of the most significant economic stories of this decade. In 2026, India becomes the 4th largest economy by nominal GDP, overtaking Japan – a major milestone that reflects deep structural transformation.
What Is Driving India’s GDP Growth?
Several powerful forces push India’s GDP higher year after year. These include:
- Strong domestic consumption: Firstly, India’s large and growing middle class spends more on goods, services, and technology.
- Government infrastructure push: Secondly, spending on roads, railways, ports, and urban development adds directly to GDP and attracts foreign investment.
- Services sector growth: Moreover, India’s IT and software exports continue to grow rapidly and bring in significant foreign exchange.
- Production Linked Incentive (PLI) schemes: Furthermore, these government programmes attract global manufacturers to India, boosting its share in global supply chains.
- Young workforce: Unlike Japan or Germany, India has a large, young, and increasingly educated population that acts as a demographic dividend for growth.
According to the IMF, India could surpass Germany and Japan in nominal GDP by the early 2030s, provided it sustains its current growth trajectory of around 6 to 7 percent annually.
Regularly reading current affairs helps aspirants understand global economic trends like GDP rankings and international economic comparisons.
Which GDP Ranking Should You Use – Nominal GDP or GDP based on PPP?
Both rankings tell you something important, but they answer different questions. Therefore, choose the right metric based on your purpose.
Use Nominal GDP when you want to:
- Understand a country’s position in global trade and international finance.
- Compare the size of national economies in US dollar terms.
- Assess a country’s ability to repay foreign debt.
- Track how much a country spends on international goods and services.
Use GDP by PPP when you want to:
- Compare living standards across countries.
- Understand domestic economic output more accurately.
- Assess poverty levels and real purchasing power.
- Look at how much the average person can actually buy with their income.
Students preparing for civil services can explore UPSC coaching in Assam for expert guidance, structured study plans, and exam-focused mentorship.
Conclusion:
In conclusion, the top 10 economies in the world by GDP (2026) highlight the shifting balance of global economic power. While nominal GDP ranking continues to show the dominance of developed economies like the United States and Germany, GDP by PPP ranking clearly reflects the rising strength of emerging economies such as China and India.
Moreover, the comparison between nominal GDP vs PPP provides a deeper understanding of both global market power and real domestic purchasing capacity. Therefore, it becomes essential to use the right metric based on the purpose of analysis.
At the same time, India’s rise to the 4th largest economy by nominal GDP marks a significant milestone in global economics. This growth is driven by strong domestic demand, infrastructure development, and a growing services sector.
Ultimately, understanding concepts like top 10 economies in the world 2026, GDP ranking, nominal GDP vs PPP, and India GDP growth is crucial for competitive exams. It not only strengthens economic concepts but also helps in answering analytical questions in UPSC, APSC, and other State PCS exams.
Source:
Frequently Asked Questions:
Yes. India already ranks 3rd by PPP. By nominal GDP, India is projected to surpass Japan and Germany by the early 2030s, provided it sustains its current growth trajectory of around 6 to 7 percent annually. Key drivers include a young workforce, rising domestic consumption, digital transformation, and government-led infrastructure investment.
Global GDP is projected to reach approximately $123.6 trillion (nominal) in 2026, according to IMF data. By PPP, the figure rises to around $219 trillion, reflecting the combined purchasing power of all economies worldwide.
China’s PPP GDP ($43.5 trillion) is more than double its nominal GDP ($20.7 trillion) because the cost of goods, services, and labour in China is significantly lower than in the United States or Western Europe. When you adjust for what money can actually buy locally, China’s domestic economy is much larger than exchange rates suggest.
The United States is the world’s largest economy by nominal GDP in 2026 at $31.8 trillion. However, by Purchasing Power Parity (PPP), China holds the top spot at $43.5 trillion, a position it has held since 2014.
India ranks 4th in the world by nominal GDP in 2026, overtaking Japan for the first time. By PPP, India ranks 3rd globally, behind only China and the United States. India also holds the title of the fastest-growing major economy with a 6.2% GDP growth rate.